
The selling was virtually relentless in the second half of Jan-22 with a small positive FPI flow in the first half. FPIs bought $250 million in the first half and sold ($4.71) billion in the second half of Jan-22. Let us first look at the breakup of Assets Under Custody (AUC) of foreign portfolio investors (FPIs) at the close of Jan-22.
|
Industry Group |
Assets Under Custody (AUC) of FPIs – $ Billion (Jan-22) |
| Banks | 113.27 |
| IT Services | 89.85 |
| NBFCs | 81.08 |
| Oil & Gas | 66.64 |
| FMCG | 36.18 |
| Pharma & Health | 28.78 |
| Automobiles | 27.91 |
| Utilities | 26.24 |
| Capital Goods | 21.07 |
| Consumers | 17.74 |
| Telecom | 15.72 |
| Insurance | 15.20 |
| Metals | 13.54 |
| Cement | 12.04 |
| Chemicals | 11.19 |
| Retailing | 11.11 |
| Other 24 Industry Groups | 51.44 |
| Total AUC | 639.08 |
Data Source: NSDL
How the FPI AUC sectoral mix changed in Jan-22
The table above covers the top 16 sectors where AUC is more than $10 billion. Out of 40 sectors that FPIs invest in, AUC of the top-16 sectors accounted for 92% of the total FPI AUC of $639 billion. The AUC has fallen back to $639 billion, depleting $15 billion in the month of Jan-22. IT Sector took the brunt of the FPI selling leading the value depletion in the FPI AUC, as we shall later in the colour of FPI flows in Jan-22.
Financials, comprising of banks, NBFCs and insurance account for 32.8% of total FPI AUC, which approximately matches with the weight of financials in the Nifty. The other significant AUC contributors are IT at $89.85 billion, Oil & Gas $66.64 billion, FMCG $36.18 billion, Healthcare $28.78 billion and automobiles $27.91 billion.
IT and Healthcare saw maximum depletion in terms of FPI AUC in Jan-22. The other two sectors to see depletion in FPI AUC were NBFC and Retail. The fall in retail AUC can be attributed to heavy selling by FPIs in catalogue digital players like Paytm, Nykaa, Zomato and Policybazaar. In terms of AUC value gainers, banks and automobiles saw improved in AUC with utilities attracting a lot of safe-haven FPI interest in the month of Jan-22.
What sectors did FPIs buy into in Jan-22
FPIs sold $4.46 billion in Indian equities in Jan-22. This takes the total FPI selling in last 4 months to nearly $10 billion on a net basis; after adjusting for the IPO inflows of FPIs.
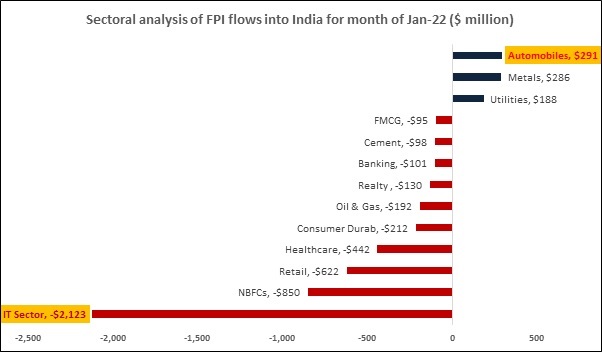
With $4.46 billion of net selling by FPIs in Jan-22, it was obvious that selling sectors would dominate buying sectors amidst a sea of red. However, there was net buying visible in a handful of sectors. Automobiles saw net buying in Jan-22 to the tune of $291 million, largely on account of buying into the EV story. FPIs also bought metal stocks worth $286 million and utility stocks worth $188 million, more as a safe haven hedge in a volatile market.
Sectors that FPIs sold into in Jan-22
FPI selling in Jan-22 was dominated by the IT sector, especially after the results hinted that most large IT companies faced the twin headwinds of weaker operating profit margins and steep attrition rates. FPIs net sold IT stocks worth $2,123 million and NBFCs worth $850 million in the month of Jan-22. In the last 2 months, FPIs have sold NBFC stocks worth $1.6 billion on fears of stretched valuations.
Despite a hawkish scenario painted by the Fed, the selling in banks was quite subdued and the bank AUC gained sharply over the previous month. This could be attributed to the fact that most banks are reasonably priced and recent RBI data indicates that the worst may be over in terms of asset quality risk. However, a lot of other sectors saw a sharp sell-off.
Retail saw FPI outflows of $622 million on heavy selling in the recently listed digital plays. Healthcare sector saw outflows of $442 million on absence of fresh triggers and pressure in the API business. Among other sectors to witness heavy FPI selling were Consumer Durables ($212m), Oil & Gas ($192m) and Realty ($130m).
IPO versus Secondary Market flows of CY 2021 and 2022
|
Calendar Year 2021 |
FPI Flows – Secondary Markets |
FPI Flows – IPOs |
Overall FPI Flows |
Cumulative FPI Flows |
| Year 2021 | -7,070.50 | +10,830.64 | +3,760.14 | +3,760.14 |
| January 2022 | -4,437.78 | -22.04 | -4,459.82 | -4,459.82 |
Data Source: NSDL (all figures in $ million)
The positive takeaway is that if IPOs raised Rs1.31 trillion in calendar 2021, they are expected to raise Rs2.20 trillion in calendar 2022. For now, a lot will predicate on the upcoming LIC IPO and how the Fed hawkishness translates into policy action.
Related Tags
![]() IIFL Customer Care Number
IIFL Customer Care Number
(Gold/NCD/NBFC/Insurance/NPS)
1860-267-3000 / 7039-050-000
![]() IIFL Capital Services Support WhatsApp Number
IIFL Capital Services Support WhatsApp Number
+91 9892691696
Download The App Now
Follow us on
2026, IIFL Capital Services Ltd. All Rights Reserved
IIFL Capital Services Limited - Stock Broker SEBI Regn. No: INZ000164132, PMS SEBI Regn. No: INP000002213,IA SEBI Regn. No: INA000000623, SEBI RA Regn. No: INH000000248, DP SEBI Reg. No. IN-DP-185-2016, BSE Enlistment Number (RA): 5016
ARN NO : 47791 (AMFI Registered Mutual Fund & Specialized Investment Fund Distributor), PFRDA Reg. No. PoP 20092018

This Certificate Demonstrates That IIFL As An Organization Has Defined And Put In Place Best-Practice Information Security Processes.


