Table of Content
There are many ways to evaluate stocks but the most common practice followed by traders over time is technical analysis This method identifies prevailing and reversal trends in the market and alerts traders as well. Pie charts, bar charts, line charts, and candlestick charts are some of them that are mostly used by traders.
The most popular one is the candlestick chart as it determines price variations at four distinct points, i.e., open, close, high, and low. Matching low is one type of candlestick pattern. This article details the matching low candlestick pattern and the psychology behind this theory.
The matching low appears to be two bearish candlesticks in a bullish trend reversal pattern. In other words, this pattern takes place during the downtrend. The matching low candlestick pattern aids traders to anticipate the direction in which the market is moving – same or opposite.
This concept assumes that the selling is going to cease, showing that the price of the stock has reduced to the bottom. Traders get to see the matching low candlestick pattern when they witness price at the support level. At times, the price of the stock can go any side, but on many occasions, the traders see the plummeting side. The matching low pattern works on the idea of market sentiment. That’s how the share market operates with incessant volatility. Traders can see the matching low candlestick pattern only if it meets the following criteria.
From the above concept, the second candle closing at the same price would lead to a decline in the price, thereby leading to a bullish trend reversal. Bull traders leverage this to try and make a quick recovery post decline. This makes a different trend altogether, yet a higher one. To help you understand this concept very clearly, here’s a small instance.
Let’s say there’s Company A and Company B. They both deal with the same kinds of products and are rivals.
Most of the customers are attracted to the products of Company A because of the lower prices though their quality is not a big hit in the market. While Company B sells a different variety of the same product but with a hint of variation and superior quality. The price of the products is slightly higher in this case, Therefore, they come up with a discount sale and free sampling concept to let the customers know the quality they are providing for the value they pay for.
This changed the fate of Company B, resulting in tons of customers’ visits since their next sale. Woefully, the sales of Company A plummeted to the bottom. While they planned to come up with another big idea to gain the trust of their customers, the stock price of their company started to nosedive. This led to a continuous selling of the Company A stocks in the market. Now, every company has a certain amount of revenue and factors that affirmatively delineate the business. This would aid the price of the stock to pause from falling and hit the support level.
Whenever the price of the stock touches the support level, traders can witness a surge in prices due to buying push or a plunge due to the least possible selling in the market. Long story short, traders can discern a matching low pattern when there’s a precipitous dwindle in the price of the stock. It gives a signal that the stock price has sloped down to its bottom or support level.
In the beginning, you’ll witness two candles where the first black one comes initially and the other one opens higher on the following day but above the closing price of the last day. Like the first candle, the second one does close similarly and at almost the same rate as that of the first day.
The moment you spot this pattern, you’ll get to see the price of the stock touching its bottom or support level. From this, one can say that the plunge in the price will carry on ahead of time. Here, the bull traders enjoy the opportunity of rising prices as opposed to the closing price of the last day. This is for the first black long candle. With the second candle, due to falling prices, the bears lost in the middle. Now, the stock price can shoot up or plummet along.
The whole theory of the matching low pattern is about bulls and bears making their moves and trying to take control over one another. If the market goes steeply south, the bears relish the spike in confidence and decline in the bulls. As a result, the stock price would probably slump even more. When the second candle’s gap between the closing and opening widens, the bulls gain power over the bears. This signals the reversal of the bearish trend followed by the probability of a price rise of the stock.
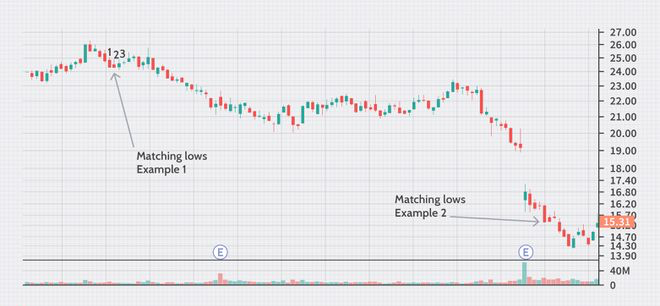
Let’s consider Macy’s Inc. The stock of the company displays a candlestick chart with two matching low candles. The stock price reached beyond the pattern of the two candles, resulting in a slight increase. Even a false breakout under candle three was witnessed on the candlestick chart.
Ans. The matching low candlestick pattern consists of two candles with bullish reversal appearances. You can expect this pattern post the downtrend, but in reality, action speaks volumes. The selling push comes to a close and both the candles close almost the same. The confirmation candle reaffirms the traders about the indicator’s signal, conveying the message of a surge in the stock price.
Ans. From the matching low pattern, traders can come to several opinions and conclusions. The bearish reversal gives concealed data to the traders. The first candle carries the plummeting trend while the bulls enjoy the vote of confidence to open high upon the previous day’s closing price.
![]() IIFL Customer Care Number
IIFL Customer Care Number
(Gold/NCD/NBFC/Insurance/NPS)
1860-267-3000 / 7039-050-000
![]() IIFL Capital Services Support WhatsApp Number
IIFL Capital Services Support WhatsApp Number
+91 9892691696
Download The App Now
Follow us on
2026, IIFL Capital Services Ltd. All Rights Reserved
IIFL Capital Services Limited - Stock Broker SEBI Regn. No: INZ000164132, PMS SEBI Regn. No: INP000002213,IA SEBI Regn. No: INA000000623, SEBI RA Regn. No: INH000000248, DP SEBI Reg. No. IN-DP-185-2016, BSE Enlistment Number (RA): 5016
ARN NO : 47791 (AMFI Registered Mutual Fund & Specialized Investment Fund Distributor), PFRDA Reg. No. PoP 20092018

This Certificate Demonstrates That IIFL As An Organization Has Defined And Put In Place Best-Practice Information Security Processes.